
Orderbook Visualization in Python
In this article we are gonna be visualizing a LOB in python using matplotlib.

In this article we are gonna be visualizing a LOB in python using matplotlib.
In one of the next articles I’m gonna be collabing with TaiwanQuant to create a python library that let’s you visualize orderbooks in real time using OpenGL!
Stay tuned for that and keep in mind that the summer sale is running until the end of august: https://www.vertoxquant.com/50cb9c2e
Table of Content
Local Orderbook in Python
Data
Visualization in Matplotlib
Final Remarks
Local Orderbook in Python
There are a couple of different ways we can go about this. One way would be to have 2 arrays, one for bids and one for asks that covers some price range and the entries will be.
While this works it’s far from ideal due to how the data looks like.
Each datapoint is an orderbook update which contains the affected price and the new size at the given price.
Because of this a way better approach would be to use dictionaries for bids and asks, that way we can do our orderbook updates in O(1) time.
Arrays do have one advantage over the dictionaries. Finding the best bid and best ask only takes O(1) time as opposed to O(n) time in a dictionary.
We can get around this by simply using some more memory and keeping track of the best bid and best ask in separate variables.
Let’s code this all up:
class OrderBook:
    def __init__(self):
        self.bids = {}
        self.asks = {}
        self.best_bid = 0 # Smallest possible value
        self.best_ask = float('inf') # Biggest possible value

    def update_bid(self, price, size):
        if size == 0:
            if price in self.bids:
                del self.bids[price]
                self.best_bid = max(self.bids.keys())
        else:
            self.bids[price] = size
            self.best_bid = max(self.best_bid, price)

    def update_ask(self, price, size):
        if size == 0:
            if price in self.asks:
                del self.asks[price]
                self.best_ask = min(self.asks.keys())
        else:
            self.asks[price] = size
            self.best_ask = min(self.best_ask, price)
This is a pretty straightforward and simple implementation of an orderbook. This can be made much more complex through data structures like binary heaps or AVL trees or whatever serves your purpose but python isn’t really suited for that, you would want to use a different language. If you need to go to such lengths then python is probably too slow anyways. We simply want to visualize so this is fine for us, we aren’t building a high frequency trading system.
Data
We will be using L2 Orderbook Update data from UNIUSDT perp on binance on the 21th of august.
I’m gonna use data from tardis but you can collect the data live from any exchange you want. (I can do a tutorial on this as well if you guys want!)
data = pd.read_csv("binance-futures_incremental_book_L2_2023-08-21_UNIUSDT.csv").set_index('timestamp')I use UNI instead of something like BTC because of the size of the data. The size of this data is 287MB but for BTC it would have been multiple GB!
Here is what our data looks like:

Everything here is pretty self-explanatory except perhaps “is_snapshot”.
We get a snapshot once a day, if that field is set to “True” then this is not actually an orderbook update but it just shows the current state of the orderbook.
Visualization in Matplotlib
So we will first loop over all the ones where this is true to initiate our orderbook and then plot this.
For each orderbook update we update our local orderbook and then plot again.
Now this is a little too much, we don’t need to plot every single update.
Let’s only plot every 1s for the first 100k datapoints:
plt.figure(figsize=(10, 6))

LOB = OrderBook()

old_timestamp = data.index[0]

for i in range(100000):
    cur_data = data.iloc[i]

    if cur_data['side'] == 'ask':
        LOB.update_ask(cur_data['price'], cur_data['amount'])
    else:
        LOB.update_bid(cur_data['price'], cur_data['amount'])

    if not cur_data['is_snapshot']:
        if (data.index[i] - old_timestamp)/1000000 >= 1:
            ask_prices = list(LOB.asks.keys())
            ask_sizes = list(LOB.asks.values())

            bid_prices = list(LOB.bids.keys())
            bid_sizes = list(LOB.bids.values())

            norm_sizes = np.interp(ask_sizes + bid_sizes, (0, 1000), (0, 1))
            norm_sizes[norm_sizes > 1] = 1

            plt.scatter([data.index[i]]*len(ask_prices + bid_prices), ask_prices + bid_prices, c=norm_sizes, cmap="viridis", s=1)

            old_timestamp = data.index[i]
Nice! But we really don’t need to see that many levels, midprice looks almost flat.
Let’s look at everything 1% above and below midprice.
(Who are those people trying to buy UNI at $1 anyways?)
plt.figure(figsize=(10, 6))

LOB = OrderBook()

old_timestamp = data.index[0]

for i in range(100000):
    cur_data = data.iloc[i]

    if cur_data['side'] == 'ask':
        LOB.update_ask(cur_data['price'], cur_data['amount'])
    else:
        LOB.update_bid(cur_data['price'], cur_data['amount'])

    if not cur_data['is_snapshot']:
        if (data.index[i] - old_timestamp)/1000000 >= 1:
            midprice = (LOB.best_ask + LOB.best_bid)/2

            asks_temp = {key: value for key, value in LOB.asks.items() if key <= 1.01*midprice}
            bids_temp = {key: value for key, value in LOB.bids.items() if key >= 0.99*midprice}

            ask_prices = list(asks_temp.keys())
            ask_sizes = list(asks_temp.values())

            bid_prices = list(bids_temp.keys())
            bid_sizes = list(bids_temp.values())

            norm_sizes = np.interp(ask_sizes + bid_sizes, (0, 10000), (0, 1))
            norm_sizes[norm_sizes > 1] = 1

            plt.scatter([data.index[i]]*len(ask_prices + bid_prices), ask_prices + bid_prices, c=norm_sizes, cmap="viridis", s=1)

            old_timestamp = data.index[i]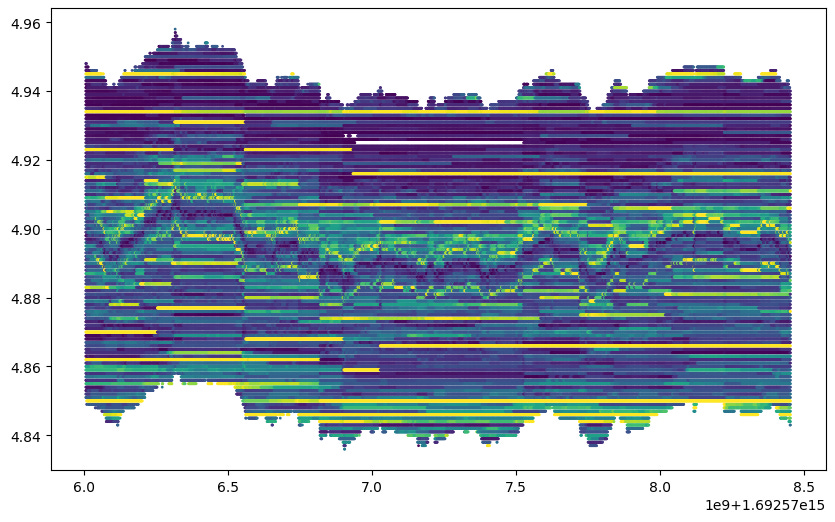
Is it just me or are orderbook visualizations so beautiful? Let’s put some more detail in there and do every 0.1s:

That didn’t improve much so we are gonna stay with 1s. Time to run it on the entire day of data!

Interesting to see how the bid sizes were a lot bigger than ask sizes during the entire day.
You can also see some interesting properties of the orderbook here like whenever price reaches a big level it tends to revert back.
Final Remarks
One big problem with this is the time, plotting the whole day of secondly data took 3 hours!
As mentioned I’m partnering up with TaiwanQuant to create a python library that let’s you visualize Orderbooks in real time using OpenGL.
As you can probably imagine OpenGL is a LOT faster than Matplotlib.
If you guys want to see any specific features please let me know by either commenting under this post or messaging me on twitter (@vertox_df) or discord (vertoxd).
you cooked with this one
Did the OpenGL version ever come out? And the partnership with Taiwan quant?