
Volatility Forecasting from High-Frequency Quotes
and the pitfalls to look out for.

Happy New Year, dear reader!
Getting access to high-frequency data in crypto is easier than in any other market. Even if you don’t want to spend a couple of hundred or thousand dollars on historical data, you can set up data collection yourself pretty cost-efficiently and reliably.
We show how to use this high-frequency data to get better forecasts of volatility, compare different volatility forecasting models, and show how to properly diagnose a volatility forecasting model.
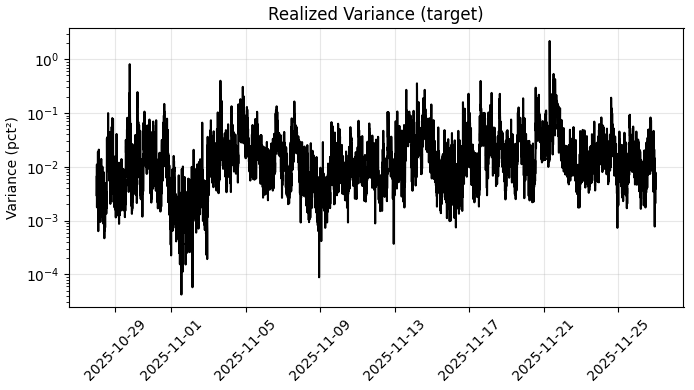
Table of Contents
Realised Variance from High-Frequency Returns — Our Forecast Target
Range-based Variance Estimators — Sometimes, Less is More
Sampling Frequency — The Problem with High Frequency Data
Rolling Averages and EWMA — Baseline Variance Forecasts
Tuning EWMA via QLIKE — A Proper Scoring Rule for Variance
GARCH Family — Conditional Heteroskedasticity Models
Stochastic Volatility and Kalman Filters — How to Actually Use a Kalman Filter
Volatility Forecast Diagnostics — What Model is The Best?
Final Remarks — Conclusion, Code, and Discord